
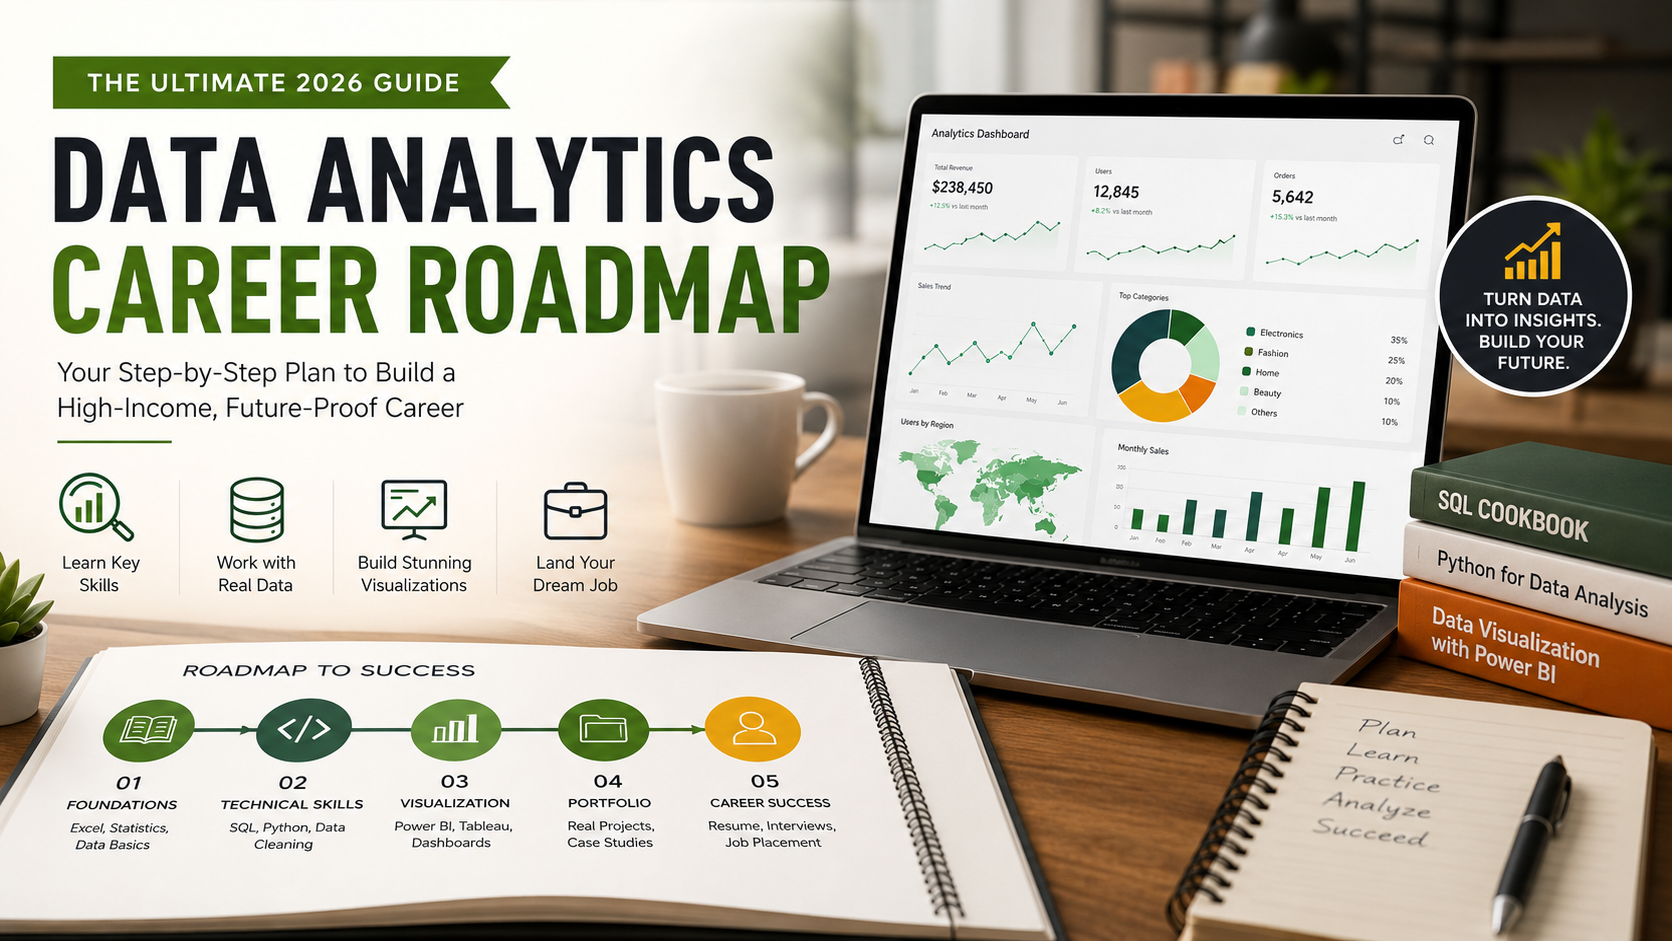
Data Analytics Career Roadmap: The Ultimate 2026 Guide
The modern corporate landscape generates massive amounts of information daily. Consequently, data-driven decision-making has become the core engine of modern corporate growth. If you want to break into this lucrative industry, having a structured Data Analytics Career Roadmap is absolutely essential. Organizations worldwide rely heavily on analytical professionals to optimize daily operations. They also use analytics to predict shifting market trends and improve customer experiences. By mastering the right combination of technical skills and business acumen, you can build a highly rewarding, future-proof career. According to the official U.S. Bureau of Labor Statistics, employment for qualified analytical professionals is projected to grow significantly faster than the average for all occupations over the next decade. This rapid expansion ensures abundant opportunities across diverse sectors like finance, healthcare, e-commerce, and technology.
Navigating this career shift can feel incredibly overwhelming. The sheer volume of coding languages, software platforms, and mathematical frameworks confuses many beginners. Fortunately, this comprehensive guide simplifies the training process. We break down your professional development journey into distinct, actionable phases. We will cover everything from foundational data concepts to core database programming languages. Furthermore, you will learn about advanced business intelligence dashboards and essential workplace communication skills. You will also learn how to construct a standout project portfolio. Finally, we map out how to successfully position yourself for entry-level roles. By committing to this step-by-step framework, you can eliminate the guesswork from your education. Instead, you can focus entirely on mastering the high-income skills that modern corporate hiring managers actively seek.
Phase 1: Foundations of the Data Analytics Career Roadmap
Every successful data professional starts by mastering the fundamental principles of data manipulation and mathematical logic. You absolutely do not need a formal computer science degree to begin this journey. However, you must develop a highly disciplined, analytical mindset. The early stage of your learning process should focus heavily on understanding data structures. You must learn how information is structured, cleaned, and summarized. Skipping these basics to jump directly into complex machine learning algorithms is a common mistake. Unfortunately, this shortcuts your education and leads to severe gaps in knowledge down the line.
Mastering Excel and Spreadsheet Data Basics
Before diving into complex programming languages, you should completely master advanced spreadsheet software. Tools like Microsoft Excel or Google Sheets are excellent starting points. Excel remains an absolute industry staple for quick data manipulation, ad-hoc sorting, and basic financial modeling. It is used daily by organizations of all sizes. Focus your energy on learning advanced functions such as VLOOKUP, XLOOKUP, and INDEX/MATCH. You must also master Pivot Tables and Pivot Charts. These features allow you to summarize thousands of rows of raw data with just a few clicks. Understanding how to clean messy data builds the core logical foundation required for advanced data tools. It helps you isolate duplicates and organize unstructured information within a spreadsheet environment. Spend ample time practicing these operations until handling large tables becomes second nature.
Understanding Descriptive Statistics for Data Strategy
Data interpretation relies heavily on basic mathematics and statistical concepts. These frameworks allow you to describe the core characteristics of a dataset accurately. You need to confidently understand and calculate standard metrics like the mean, median, and mode. Additionally, you must master standard deviation and variance. These standard metrics allow you to summarize massive datasets quickly. They also help you identify initial patterns or anomalies within the numbers. Furthermore, you should familiarize yourself with probability distributions, hypothesis testing, and regression analysis. These concepts help you validate your business assumptions scientifically. Knowing the math behind the data ensures that you do not misinterpret random fluctuations as meaningful corporate trends. This statistical literacy transforms you from a basic tool operator into a truly insightful analyst.
Phase 2: Technical Analytics Skills for Data Professionals
Once you master the foundations, the next step involves learning advanced data tools. These technologies are specifically designed to handle millions of rows of data effortlessly. Transitioning from spreadsheets to databases and programming languages allows you to automate repetitive tasks. It also empowers you to conduct much deeper investigations. This phase requires consistent hands-on coding practice. Daily practice builds the muscle memory needed for real-world engineering environments.
Structured Query Language (SQL) for Data Management
SQL is the absolute backbone of data analytics. Consequently, it remains the most frequently requested skill in job postings worldwide. Modern companies store their valuable operational information in relational databases. SQL is the universal language used to communicate with these robust systems. You must learn how to write optimized queries to extract and filter data. You will also use it to manipulate and aggregate data from multiple connected tables.
-
Basic Queries: Master the fundamental syntax including
SELECT,WHERE,GROUP BY,HAVING, andORDER BYto filter data accurately. -
Joins: Thoroughly understand how to combine disparate tables using
INNER JOIN,LEFT JOIN,RIGHT JOIN, andFULL OUTER JOIN. -
Advanced SQL: Learn complex window functions, subqueries, data type casting, and common table expressions (CTEs) for complicated multi-step analysis.
Programming Analytics Solutions with Python or R
Spreadsheets have rigid row limitations. Programming languages, however, allow you to process massive data arrays easily. They also enable you to build automated data pipelines. Python is highly recommended for beginners due to its clean syntax and vast community support. Focus heavily on learning specific data libraries like Pandas for data manipulation. You should also study NumPy for numerical calculations, and Matplotlib or Seaborn for basic charting. Practice importing messy CSV files, handling missing values, and changing data formats. You must also practice exporting cleaned datasets ready for corporate reporting. Developing a solid command of Python code elevates your analytical capabilities far beyond standard corporate software packages.
Phase 3: Data Visualization and Business Intelligence Pathways
Extracting and cleaning data is only half the battle. You must also present your technical findings in a visually striking way. Non-technical stakeholders must be able to easily comprehend your reports. Corporate executives rarely want to look at raw code or massive tables of numbers. Instead, they require clear visual trends to make rapid strategic choices.
Power BI and Tableau Dashboarding Strategies
Business Intelligence (BI) platforms allow you to convert raw databases into beautiful reports. They help you build interactive dashboards that update automatically. Both Microsoft Power BI and Tableau dominate the corporate landscape. Therefore, mastering at least one of these platforms is non-negotiable for your career. Practice connecting these visualization tools directly to your local SQL databases or cloud storage files. This allows you to create real-time operational reports. Focus on learning how to design intuitive user interfaces. You must use color theory effectively to highlight key performance indicators (KPIs). Additionally, implement drill-down features that let users explore specific data segments. Developing these dashboard creation skills ensures that your work provides continuous, automated value to your business team.
The Art of Executive Data Storytelling
A truly great analyst is not just a technician. You must become an excellent corporate storyteller who bridges the gap between numbers and human action. You must learn how to look at a completed chart and extract the underlying business narrative. Then, explain what the data means for the company’s bottom line clearly. Structure your presentations by highlighting the core problem first. Follow this with the insights discovered during your research, and conclude with actionable strategic recommendations. Avoid confusing your audience with excessive technical jargon or unnecessary mathematical explanations during executive meetings. Instead, focus entirely on how your analytical insights can reduce operational expenses. Show management how to boost customer retention or uncover hidden revenue streams for the business.
Phase 4: Portfolio Building and Job Application Strategy
You must prove your analytical expertise to hiring managers to secure interviews. To do this, you need a diverse public project portfolio that showcases your practical problem-solving skills. A strong portfolio acts as concrete proof of your capabilities. This validation is especially vital if you do not have prior professional tech experience.


Creating Real-World Data Analytics Projects
Avoid using generic, overused datasets like the Titanic survival logs or the Iris flower dataset. These options are common in basic online tutorials. Unfortunately, they immediately signal to recruiters that you are a beginner. Instead, find unique, messy data from public repositories like Kaggle or Google Dataset Search. You can also scrape your own data from public websites using Python. Clean the raw information thoroughly using Python scripts. Next, write complex SQL queries to uncover deeper relationships. Finally, visualize your conclusions within an interactive Power BI dashboard. Document your entire analytical process from start to finish. Ensure you clearly explain the specific business problem you set out to solve and the final recommendations you generated.
Structuring Your GitHub and Resume Portfolio
Host all your project code on GitHub professionally. Write highly detailed, professional README files that explain the commercial context of your work clearly. Update your resume to focus heavily on the measurable business impact of your projects. Avoid simply listing the names of technical software tools. Use strong action verbs and quantifiable achievements. For example, state how your data cleaning process optimized storage. Alternatively, explain how your dashboard saved manual reporting hours. Additionally, optimize your LinkedIn profile by sharing your project updates regularly. Write short articles about data trends, and actively network with engineering managers working in your target industries.
Frequently Asked Questions
How long does it take to complete a data analytics career roadmap?
Completing a comprehensive data analytics career roadmap typically takes between six months to a full year of consistent, dedicated daily study. If you can realistically commit roughly 15 to 20 hours per week, you can comfortably master foundational Excel, basic descriptive statistics, and essential SQL database queries within the first four months. Learning Python programming, mastering business intelligence tools like Tableau, and constructing a unique project portfolio generally requires an additional three to four months of practical application. The exact timeline depends heavily on your prior technical background, math literacy, and the amount of time you devote to hands-on coding practice each day. Furthermore, staying updated with emerging AI integration trends in popular data platforms might require ongoing professional development, but the core foundation remains highly stable throughout this standard learning lifecycle.
Do I need a degree in math or computer science to become a data analyst?
No, you absolutely do not need a formal university degree in mathematics, statistics, or computer science to successfully break into this professional field. Many highly successful data analysts transition into the tech industry from completely unrelated backgrounds, including marketing, hospitality, liberal arts, and healthcare. Modern corporate employers care significantly more about your practical problem-solving abilities, portfolio quality, and tool proficiency than your specific college major. Demonstrating your technical skills through well-documented, real-world case studies on GitHub is the most effective way to prove your competency to hiring managers and secure interviews without a tech degree. A strong, business-focused project portfolio showcasing end-to-end analytical abilities will consistently outweigh an unrelated or purely academic background during the recruitment process.
Which language should I learn first for data analytics, Python or R?
Python is generally the best language to learn first when starting your data analytics career roadmap journey. Python features a very clean, highly readable syntax that closely mimics natural English, which makes it incredibly accessible for absolute programming beginners. Furthermore, Python is widely adopted across a massive variety of industries, including machine learning, web development, cloud engineering, and automated scripting. While the R programming language remains excellent for academic research, specialized financial environments, and advanced statistical modeling, Python offers much greater long-term career flexibility and a substantially larger global ecosystem of libraries and support forums. Mastering Python first also makes it significantly easier to pick up other automation and data pipeline languages later if your career transitions toward engineering.
What is the difference between a data analyst and a data scientist?
Data analysts primarily focus on analyzing historical data to identify clear trends, create descriptive reports, and answer specific, immediate business questions for management. They spend most of their time utilizing tools like SQL, Excel, and corporate BI software to help companies optimize their current daily operations. On the other hand, data scientists focus on predicting future outcomes by building advanced machine learning algorithms, complex predictive models, and custom data pipelines. Data science requires much deeper training in software engineering, calculus, linear algebra, and advanced statistical theory, making it a natural progression after working as an analyst. Ultimately, analysts explain exactly what has happened and what is happening now, while scientists build systems to forecast what will likely happen next.
How can I gain practical data analytics experience without a tech job?
You can gain valuable, practical experience by working on open-source projects, participating in Kaggle data competitions, or volunteering your analytical skills for local non-profit organizations and small businesses. Many local charities and small e-commerce shops possess plenty of operational data but completely lack the internal technical expertise required to analyze it properly. Offering to clean their messy spreadsheets and build interactive performance dashboards for free provides you with excellent, real-world experience that involves real business stakes. You can then confidently add these legitimate, impactful case studies directly to your professional portfolio to impress hiring teams. This practical approach bridges the gap between passive tutorial learning and true professional problem-solving, making you highly attractive to potential employers.
Conclusion
Following a highly structured Data Analytics Career Roadmap is the most efficient and reliable way to transition into this lucrative, fast-growing professional field. Before diving into the technical milestones, it is highly recommended to take free career assessment tests to confirm your natural mathematical aptitude and logical reasoning alignment with this specific tech path. By systematically mastering foundational spreadsheet manipulation, SQL database querying, Python programming, and interactive data visualization, you build a highly competitive technical skill set. However, you must always remember that technical tools alone are not enough to make you a successful professional; you must also master business communication, logical critical thinking, and impactful data storytelling. A successful transition requires combining these mechanical software capabilities with deep commercial domain knowledge so you can translate abstract calculations into high-value corporate actions.
Stay deeply committed to daily practice, build unique portfolio projects that solve real business problems, and continue refining your knowledge as technology evolves to successfully secure your dream role in the analytical industry. The educational path requires true patience and persistence, but the professional freedom, intellectual stimulation, and financial rewards are entirely worth the effort. By systematically executing the steps outlined in this roadmap, you will successfully stand out from the competition, fast-track your job application process, and establish a thriving data career that remains resilient in the face of shifting technological landscapes.